

What Sabermetrics Changed About Baseball Analysis
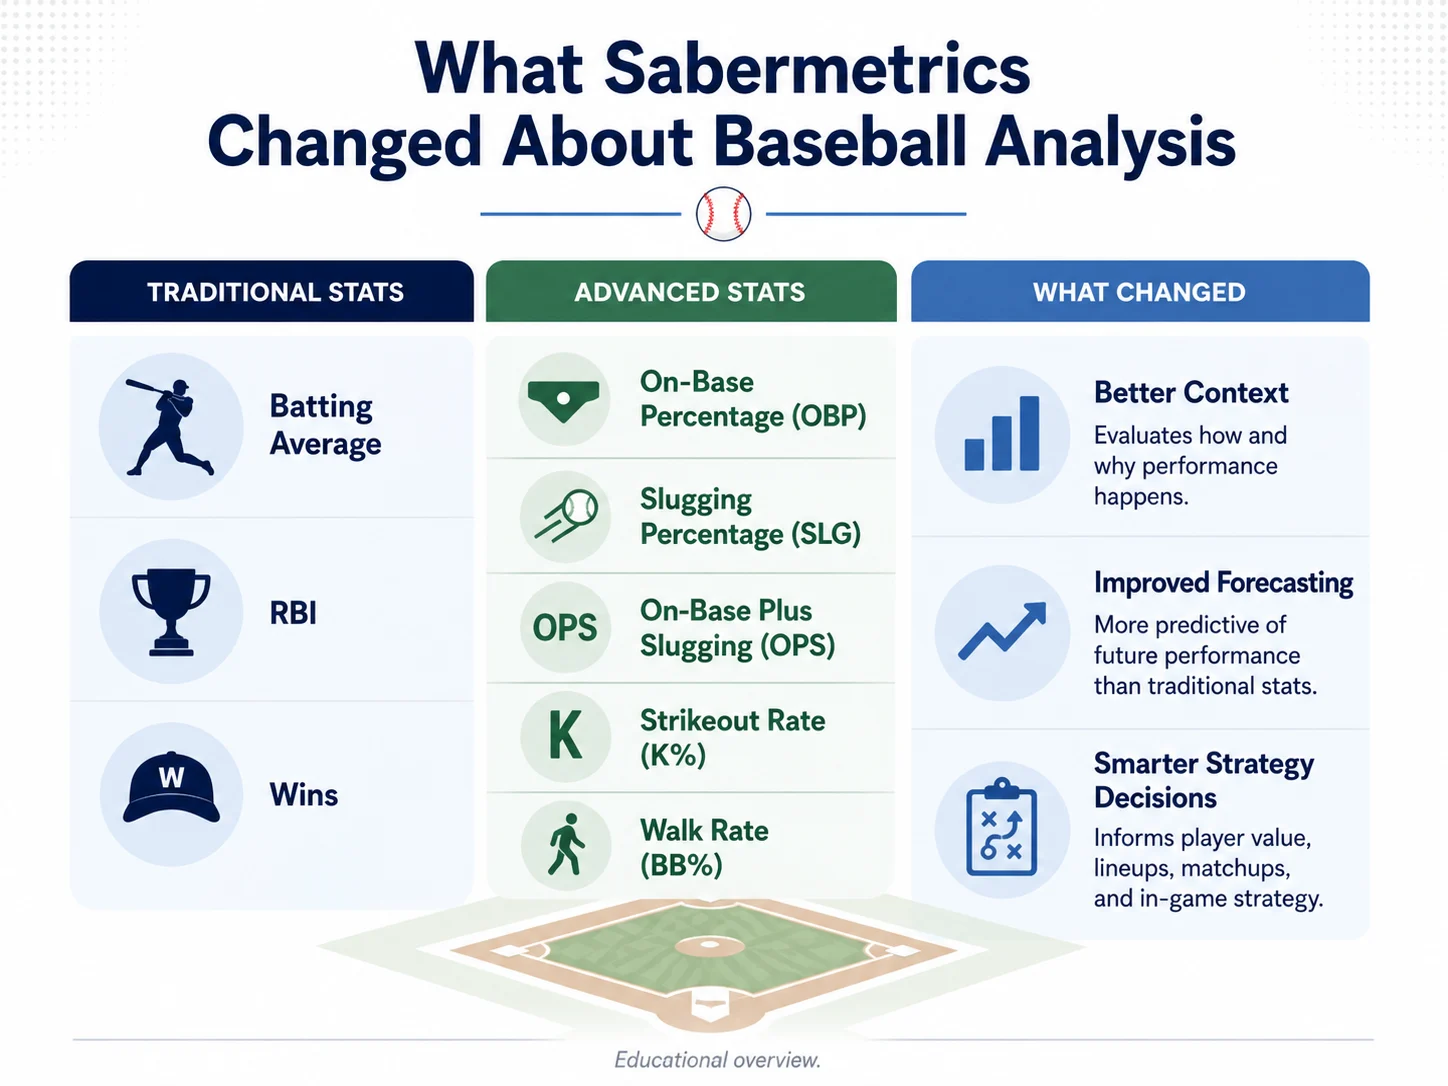
Baseball has always produced statistics, but sabermetrics changed the questions analysts ask. Traditional statistics such as batting average, runs batted in, pitcher wins, and errors summarize visible outcomes. Sabermetrics attempts to measure how players contribute to scoring and preventing runs while separating individual performance from opportunity, teammates, ballparks, defence, and luck. The term does not mean that traditional statistics are useless or that every decision can be reduced to one number. It means using evidence to examine whether familiar measures answer the question people assume they answer. Batting average is a clear example. It measures hits divided by official at-bats, but it does not include most walks and treats a single and a home run as equally successful hits. On-base percentage adds walks and hit-by-pitches because avoiding outs is central to producing runs. Slugging percentage gives additional weight to extra-base hits by measuring total bases per at-bat. OPS combines on-base and slugging percentage into an accessible summary. These measures remain imperfect, but they describe offensive contribution more completely than batting average alone. Runs batted in depend heavily on opportunity. A hitter batting behind teammates who reach base frequently will receive more chances to drive in runs than an equally skilled hitter on a weaker offence. Pitcher wins also depend on run support, bullpen performance, defence, and how long the manager allows the starter to remain in the game. Sabermetric analysis does not ignore outcomes. It asks how much control the player had over them. Modern tracking has expanded this approach. MLB’s Statcast system measures pitch velocity, movement, spin, release point, exit velocity, launch angle, sprint speed, fielder movement, arm strength, and other aspects of play. Expected statistics compare a batted ball with similar balls based on characteristics such as exit velocity and launch angle. They can help identify players whose results may have been unusually helped or harmed by defence, ballpark dimensions, or random variation. Expected performance is not guaranteed future performance. A hitter may consistently outperform a model because of speed, contact placement, or a skill the model captures imperfectly. The value of the metric is that it creates a more precise question. Defensive analysis has changed particularly dramatically. Errors record only certain failed plays and depend on the official scorer’s judgment. They do not reward a fielder who reaches difficult balls that another player would never touch. Tracking data can estimate distance, direction, time available, and the probability of completing a play. Metrics such as Outs Above Average attempt to compare fielders with similar opportunities. These models remain sensitive to assumptions and should be combined with scouting and knowledge of positioning. Strategy has also changed. Teams use data to evaluate defensive alignments, pitch selection, batter matchups, baserunning, player development, fatigue, and injury risk. The visible result has included more specialized bullpens, greater emphasis on walks and power, optimized defensive positioning, and new approaches to pitch design. Baseball rules have sometimes changed in response to strategies that became too effective or reduced entertainment, demonstrating that optimization can alter the sport itself. Data does not eliminate scouting. A statistic describes what was measured under particular conditions. Scouts can observe mechanics, adaptability, health, preparation, and personal development that a public model may not fully capture. Teams gain the most when analysts, coaches, medical staff, and scouts challenge one another rather than competing for authority. Metrics also need context. A statistic may be adjusted for league and ballpark or may not be. A small sample can produce extreme results. Catching, positioning instructions, and teamwork are difficult to assign to one player. Public models may differ because they use different data and assumptions. Fans should therefore ask what a metric measures, what it excludes, whether it is descriptive or predictive, and how much uncertainty surrounds it. Sabermetrics changed baseball by making accepted wisdom testable. It replaced questions such as “Who looks like a productive hitter?” with “Which events most consistently help a team score?” It did not end debate. It created better-informed debate and made it harder to defend a claim simply because it had always been repeated.
Sources: Society for American Baseball Research, “A Guide to Sabermetric Research”; Major League Baseball, Statcast Glossary; MLB official statistical glossary.
Image caption: Sabermetrics adds context to traditional baseball statistics by measuring on-base ability, power, plate discipline, tracking data, and the conditions surrounding performance.
Image alt text: Infographic comparing traditional baseball statistics with advanced statistics and explaining how modern analysis improves context, forecasting, and strategic decisions.