

Why Ballpark Effects Can Distort Baseball Statistics
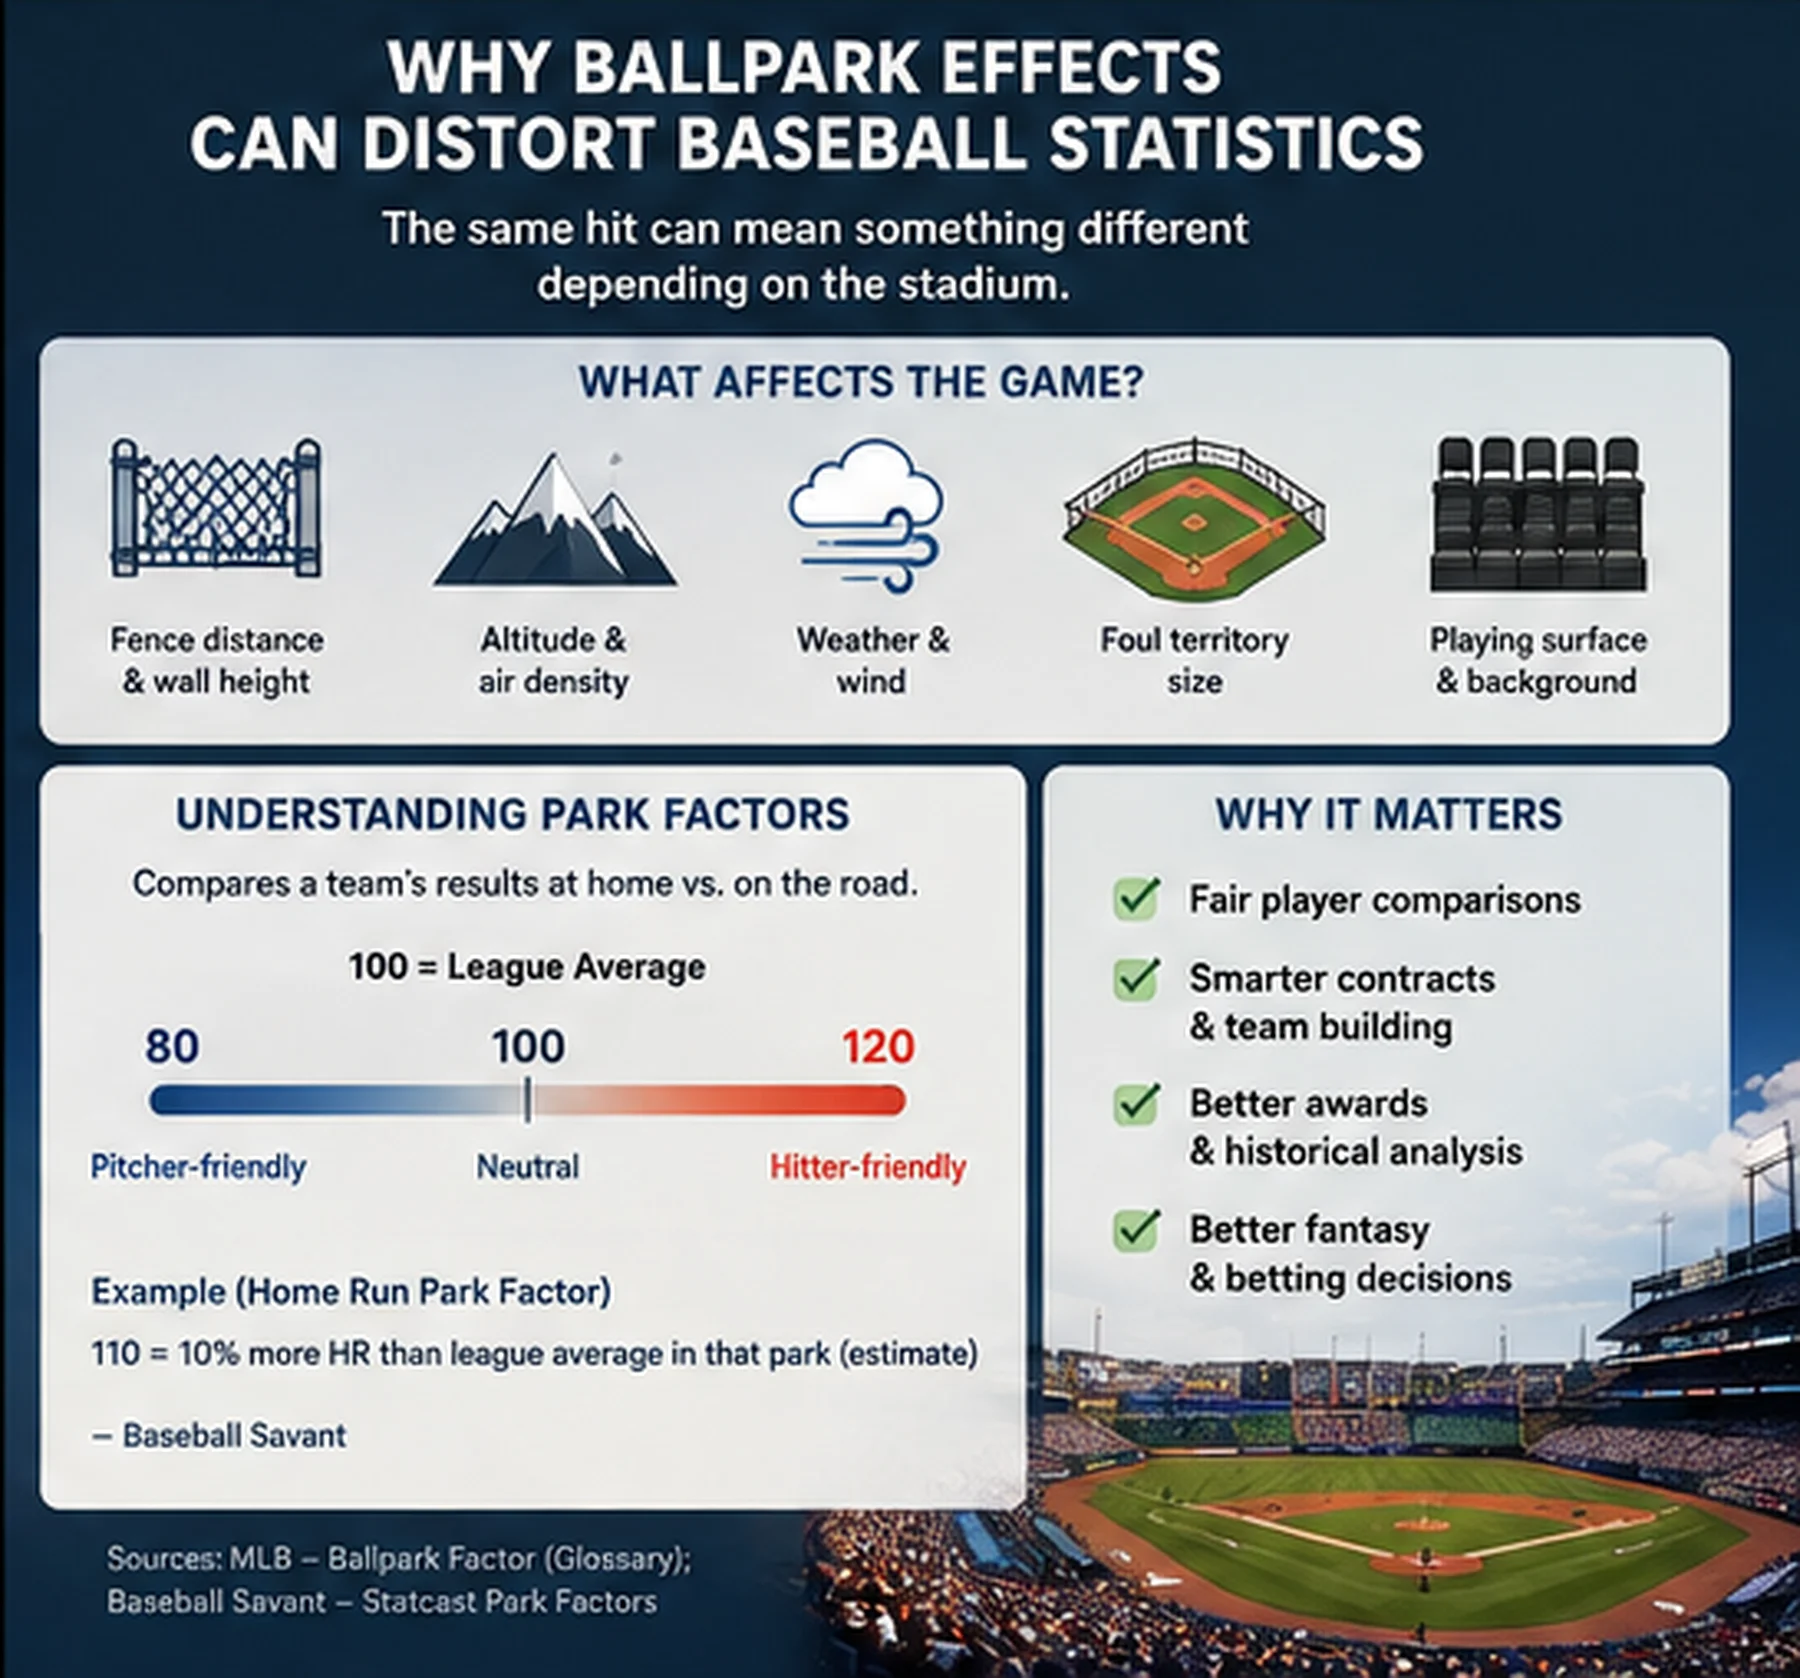
A home run, double, or run scored is recorded the same way in every stadium, but the difficulty of producing that result is not identical. Baseball parks have different dimensions, wall heights, altitudes, weather patterns, playing surfaces, foul territory, and visual backgrounds. These differences can make one stadium more favourable to hitters and another more favourable to pitchers. Comparing raw statistics without considering the park can therefore create a misleading picture of player ability. The most familiar example is the outfield fence. A fly ball that clears a short wall in one park may become a routine out in a stadium with a deeper boundary. Tall walls can turn potential home runs into doubles or singles. Large outfields may reduce home runs while increasing doubles and triples because fielders must cover more ground. Foul territory affects how often a foul ball becomes an out. The height and shape of the wall can also change rebounds and defensive strategy. Altitude and air conditions influence how the ball travels. At higher altitude, lower air density can reduce drag and allow a batted ball to travel farther. Temperature, humidity, and wind can also affect flight, although conditions vary from game to game. Park effects are not determined by one feature alone. A deep stadium can still favour scoring if the gaps are large, foul territory is small, and the environment helps the ball carry. Ballpark factor is an attempt to measure these effects by comparing outcomes in a team’s home games with outcomes in its road games. Major League Baseball’s basic definition compares runs scored by a team and its opponents at home with runs scored in that team’s road games. Similar calculations can be made for home runs, doubles, triples, and other outcomes. Modern Statcast park factors use detailed tracking data and can examine how venues affect particular batted-ball characteristics. Baseball Savant generally expresses park factors around a league-average value of 100. A value above 100 means the park increased the selected outcome relative to average, while a value below 100 means it suppressed that outcome. A home-run factor of 110 should not be interpreted as proof that every hitter will hit exactly 10 percent more home runs there. It is an estimate based on the observed environment, the chosen years, and the statistical method. Park factors commonly use multiple seasons because one year can be distorted by unusual weather, schedule, injuries, roster composition, or random variation. Baseball Savant’s three-year rolling figures include the selected season and the two previous seasons. Even multi-year measures remain estimates rather than permanent properties. Stadium renovations, changes to fence distance, new wind screens, roof usage, climate, baseball construction, and league strategy can alter the effect. Park factors matter when comparing hitters. A player who produces a .500 slugging percentage in a difficult hitting environment may have created more offensive value than a player with the same raw number in an extremely favourable park. This is why adjusted statistics attempt to account for league and park conditions. Metrics such as OPS+ and wRC+ place performance on a scale where league average is generally represented by 100, with adjustments for the player’s environment. The exact formulas differ, but the principle is that a run is easier to create in some conditions than others. Pitchers require the same context. A pitcher working in a hitter-friendly park may post a higher earned run average than an equally skilled pitcher in a run-suppressing park. Raw ERA also depends on defence, sequencing, official scoring, and inherited runners, so park adjustment does not solve every problem. It removes one important source of environmental bias. Team construction can exploit the home park. A club in a stadium with a short right-field fence may value left-handed power differently. A club with a large outfield may prioritize fast defenders who can cover space. Pitch selection may change when certain types of contact are especially dangerous. Front offices can build around these features, although players still play half their schedule on the road and must succeed in many environments. Park effects are also relevant to awards, contracts, fantasy baseball, historical comparisons, and Hall of Fame debates. Raw milestones can look different after context is considered. However, park adjustment should not be used to dismiss actual accomplishments. A player still had to hit the ball, stay healthy, and perform against major-league competition. The adjustment helps estimate how much the venue contributed to the result. It does not erase the result. Analysts should also avoid using a single park factor as a universal label. A stadium can increase home runs while reducing triples. It can favour left-handed hitters differently from right-handed hitters. Day games and night games may experience different conditions. The park can also interact with player style: a pull hitter, opposite-field hitter, ground-ball pitcher, and fly-ball pitcher will not be affected identically. The best analysis asks which outcome is being measured, over what period, and with what method. Ballpark effects demonstrate a larger lesson about sports statistics. Numbers are produced inside an environment. A fair comparison requires understanding both the result and the conditions that made the result easier or harder. Park factors do not provide a final answer about player quality, but they prevent the stadium from being mistaken for the player.
Sources: Major League Baseball, “Ballpark Factor” glossary; Baseball Savant, “Statcast Park Factors”; MLB Statcast glossary.
Image caption: Ballpark factors compare home and road outcomes to estimate how stadium dimensions and environmental conditions influence runs, home runs, and other results.
Image alt text: Infographic showing how wall distance, altitude, weather, and foul territory affect baseball outcomes and explaining the park-factor scale where 100 represents league average.