

What an Earnings Report Can Tell Investors
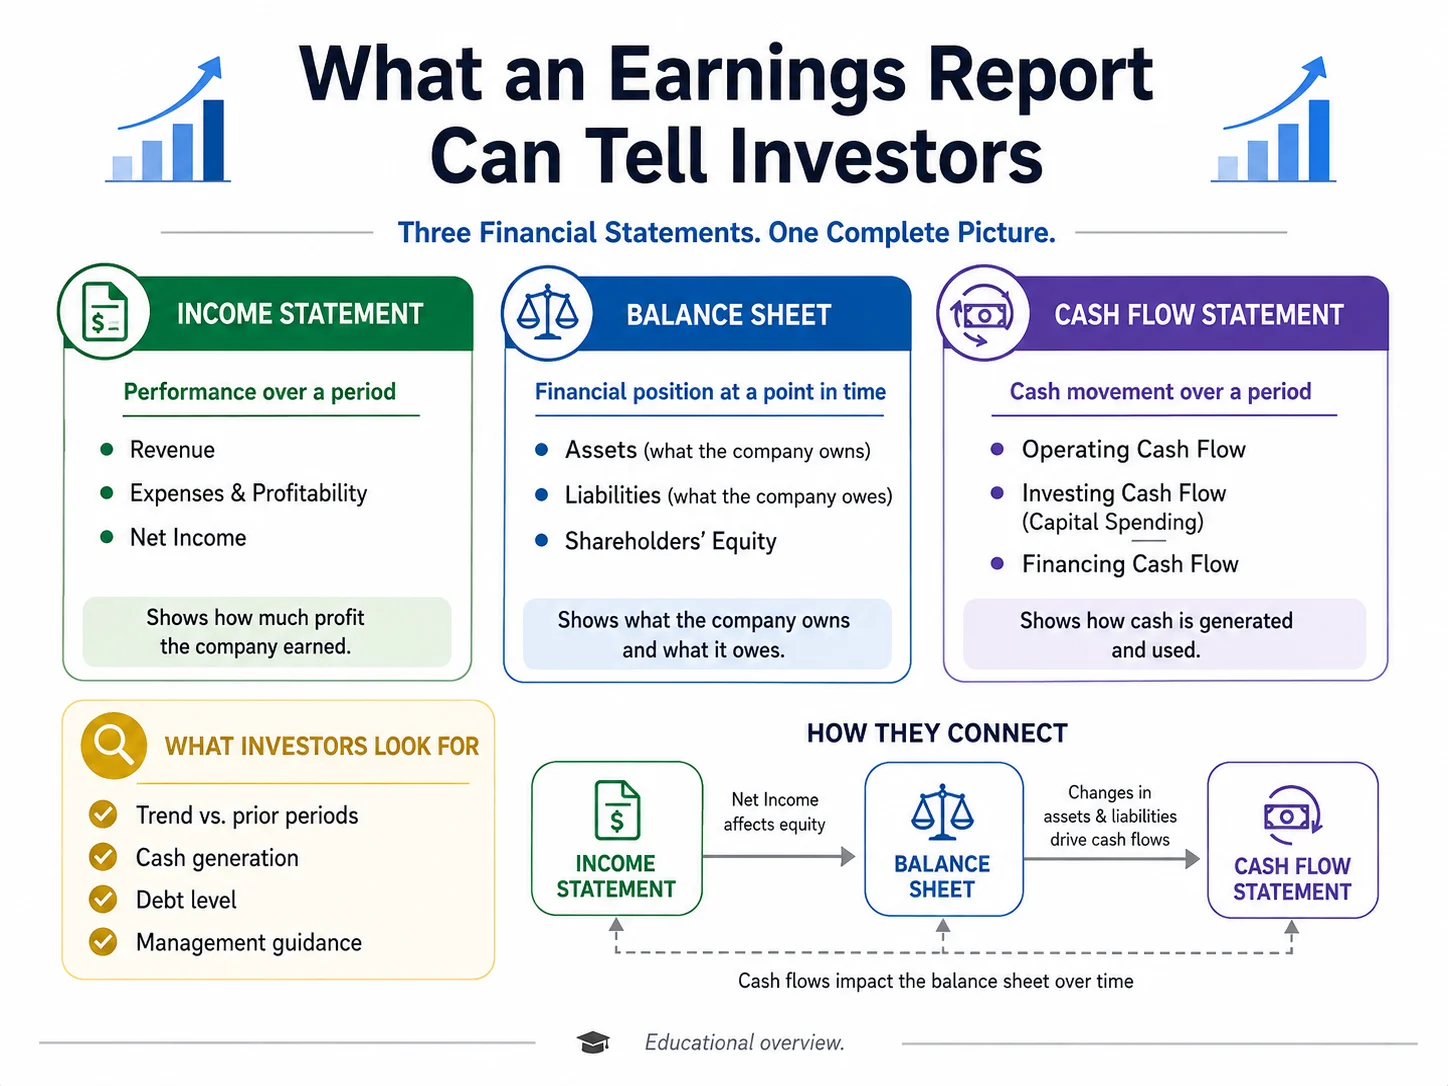
An earnings report is more than a headline announcing whether a company beat or missed expectations. It is a collection of financial statements, management explanations, risk disclosures, and operating data that can help investors understand how a business earns money, spends money, finances itself, and prepares for the future. The most useful approach is not to search for one perfect number, but to connect several parts of the report. The income statement shows financial performance over a period of time. It normally includes revenue, expenses, operating profit, taxes, and net income. Revenue growth can indicate rising demand, higher prices, acquisitions, or currency effects, but growth alone does not prove that the business is becoming stronger. A company may increase sales while spending even more on production, marketing, interest, or administration. Investors should therefore compare revenue growth with operating profit and profit margins. A falling margin may show that costs are rising faster than sales or that the company is using discounts to maintain growth. Net income also needs context because it can be affected by one-time gains, restructuring charges, asset sales, tax changes, or accounting adjustments. The balance sheet provides a snapshot of what the company owns and owes at a particular date. Assets may include cash, inventory, property, equipment, and money owed by customers. Liabilities may include supplier bills, loans, bonds, leases, and other obligations. A company with rapidly growing revenue can still become financially fragile if debt rises too quickly or customers take longer to pay. Cash reserves, debt maturity dates, interest costs, and short-term obligations deserve particular attention when economic conditions are difficult. Shareholders’ equity represents the residual value after liabilities are subtracted from assets, but it should not be treated as the same thing as market value. The cash flow statement explains how cash moved through the business. Operating cash flow shows cash generated or consumed by normal operations. Investing cash flow often includes spending on factories, equipment, acquisitions, and asset sales. Financing cash flow includes borrowing, debt repayment, dividends, and share repurchases or issuance. A profitable company can experience weak cash flow when customers have not yet paid, inventory is accumulating, or capital expenditure is high. Conversely, cash flow may look temporarily strong because the company delayed payments or sold assets. Comparing net income with operating cash flow over several periods can reveal whether reported profits are consistently supported by cash generation. Investors should also read management’s discussion and analysis rather than stopping at the statements. Management explains the causes of major changes, describes important trends, and discusses liquidity and capital needs. This section can be informative, but it is written from management’s perspective. Statements should be compared with the numbers, previous guidance, competitor performance, and earlier reports. A company that repeatedly changes its explanation for missed targets deserves closer scrutiny. Guidance is another major source of market reaction. Share prices often respond more strongly to management’s forecast than to the quarter that has already ended. A company may report record revenue while warning that future demand is weakening. It may miss current profit expectations because it is investing heavily in a new product. Investors must decide whether the change is temporary, structural, or simply uncertain. Risk disclosures can appear repetitive, but changes in wording may matter. New discussion of customer concentration, regulation, litigation, cybersecurity, supply dependence, or refinancing can identify risks that headline earnings do not capture. Footnotes are equally important because they explain accounting methods, debt terms, stock-based compensation, acquisitions, and unusual items. Comparing multiple periods is essential. One quarter can be distorted by seasonality, product timing, weather, currency movements, or a single contract. Reviewing several years and comparing results with competitors provides a better picture of the business cycle. Investors should ask: Is revenue growth profitable? Are margins improving or deteriorating? Does cash flow support net income? Is debt manageable? Are shares being issued faster than profits are growing? Has management met previous guidance? What risks have changed? An earnings report cannot reveal the future with certainty, but it can replace a story based on excitement with a structured examination of the business. The objective is not to find a number that proves a stock is good or bad. It is to understand how the company operates, what assumptions support its valuation, and what evidence would show that the investment thesis is wrong.
Sources: U.S. Securities and Exchange Commission, “Beginners’ Guide to Financial Statements”; Investor.gov, “How to Read a 10-K/10-Q”; Investor.gov, “How to Read a 10-K.”
Image caption: The three main financial statements provide different but connected views of company performance, financial position, and cash movement.
Image alt text: Infographic explaining the income statement, balance sheet, and cash flow statement and showing how investors can connect the three documents.